How do population and evolutionary genetics work?
Evolution can be a tricky thing. In some cases, it’s easy to see it happening. During the Industrial Revolution in Great Britain, for example, white moths disappeared from the population as they were more easily spotted and eaten by birds in the increasingly sooty and blackened environment.
In most cases, though, it’s not so easy to see evolution happening. It can happen slowly over many generations, or in long-lived species. It could also happen within an organism, affecting its metabolic or physiological processes, for example.
How are we supposed to know if something is evolving, then? To do that, we need to look at the genetics of an entire population and something called the Hardy-Weinberg Principle.
You! Out of the gene pool!
A gene pool isn’t really a swimming pool full of genes (as fun as that sounds). Rather, a gene pool is simply all of the genes (and their associated alleles) within an interbreeding population.
An interbreeding population is defined as one which freely interbreeds with each other, such as a group of geese who migrate to the same summer breeding grounds or a group of all the people who can meet each other. As you can imagine, the human breeding pool has become a lot larger due to globalization and the ability to meet almost anyone over the internet.
So, rather than looking at a herd of deer and wondering which ones have a particular trait, you’d instead look at a list of all the alleles for that trait in the herd’s genomes.
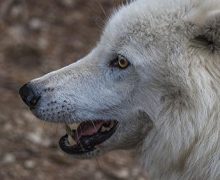
The reason we look at gene pools is because we can compare them over time. Let’s say that we were studying a population of arctic wolves. Over time, the percentage of black wolves increases. In this case, the black fur allele is increasing in frequency among the wolves. The population is evolving.
We can’t always easily see what alleles an individual has, though, like we can with black wolves. Maybe all the organisms look normal on the outside, but they have something unique hidden away within each of them. So, rather than rely on something observable, like fur color, evolutionary geneticists rely on numbers.
The Hardy-Weinberg Principle: A Magic Number
After scientists first discovered how genetics work in the late 18th century, they realized they had a problem. They knew how alleles were passed on between individuals from generation to generation, but how could they describe if populations of organisms were evolving?
Godfrey Hardy and Wilhelm Weinberg both came up with the solution in 1908—individually, oddly enough. Today, we call it the Hardy-Weinberg principle, and it measures the genetic makeup of a population at a single point in time.
If you compare the genetic makeup over time or to certain expected numbers, then boom: you can literally see if your population is evolving. In this case, we use numbers to describe what we cannot necessarily see with our eyes.
It works like this:
If there are two alleles in a population—p and q—each allele will have an allele frequency. For example, 30% of the population could have the p allele and 70% could have the q allele. Or, maybe 50% of the population has the p allele and the other 50% has the q allele.
These two alleles can make up three possible genotypes: pp, pq, and qq (the same as the YY, Yy, and yy of Mendel’s pea plants).
Here’s the cool thing: if you know the allele frequency of the two genes, you can also predict the genotype frequency in the population with some neat math:
p2 + 2pq + q2 = 1
This is because each pp individual will have two p alleles (p2), each pq individual has a p and a q allele (2pq), and each qq individual has two q alleles (q2).
This formula calculates the genotype frequencies for a population that is not evolving. If a population actually has these genotype frequencies, we say that the population is in Hardy-Weinburg equilibrium.
It might help to look at an example.
How do you calculate Hardy-Weinberg equilibrium?
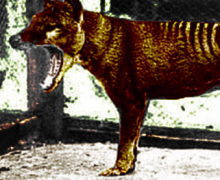
Do you remember the Tasmanian devil from the Looney Tunes? Tasmanian devils are real animals. They look like small dogs, and they’re mean. So mean, in fact, that they tend to get bitten a lot around their faces when mating.
Unfortunately, this aggressive behavior has opened the way for a deadly contagious cancer called Devil Facial Tumor Disease (DFTD) to make its way into the population. These animals are already endangered, and the tumor sure isn’t helping much.
Luckily, some of the animals in the population are resistant to the cancer. These animals are more likely to pass on their resistance genes, and so the population as a whole is evolving to become more resistant to DFTD.
But how did scientists find that out? Let’s put on our safari hats and find out.
Let’s pretend we went on a Tasmanian expedition. Once we got there, we collected DNA samples from all of the Tasmanian devils we could find. Then, we brought the samples back to the lab and analyzed them for a gene that makes the devils resistant.
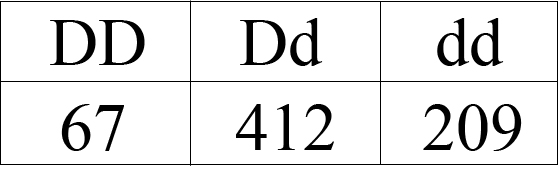
In this example, having a D allele makes devils more susceptible to the disease, while the d allele makes them more resistant. Let’s pretend this is how many animals of each genotype we measure:
Now, we need to figure out the allele frequencies for the two alleles so that we can plug them into the Hardy-Weinberg equation to see if the population is evolving.
To start, we need to know how many animals are in our “population.” For this, we simply add up all of the animals we sampled of each genotype:
Total number of animals sampled: 67 + 412 + 209 = 688
Each animal has two alleles, so we simply multiply the number of animals by two to find out how many total alleles we’re working with:
Total number of alleles: 688 • 2 = 1,376
Now we need to figure out how many of each of the two alleles are in the population. Each DD devil has two D alleles, while each Dd devil has one D allele, so we simply add these together. Then, we do the same thing for the d allele.
Number of D alleles: 67 + 67 + 412 = 546
Number of d alleles: 412 + 209 + 209 = 830
Finally, we are able to calculate the allele frequencies because we know how many of each allele we’re working with, and how many total alleles there are. So, to find the D allele frequency, we divide the number of D alleles by the total number of alleles. Then, we do the same thing for the d allele.
D allele frequency: 546 / 1,376 = 0.40
d allele frequency: 830 / 1,376 = 0.60
Now we’re able to actually use the Hardy-Weinberg equation. We know the allele frequencies for the two alleles, so we can calculate how many animals in the population there should be for each genotype if it is in Hardy-Weinberg equilibrium (i.e., is not evolving).
To do this, we multiply the total number of animals in our sample by the expected genotype frequencies as predicted by the Hardy-Weinberg equation:
Expected number of DD devils: 688 • 0.402 = 110
Expected number of Dd devils: 688 • 2 • 0.40 • 0.60 = 330
Expected number of dd devils: 688 • 0.602 = 248
Now, let’s compare the observed number of devils we actually measured of each genotype with the Hardy-Weinberg expected values:
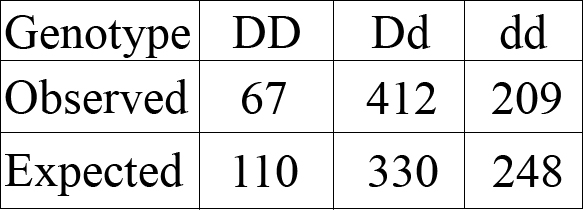
As you can see, the expected values are way off from the actual observed values. Scientists can actually see if these results are real or just random numbers from chance by using a statistical test called a χ2 (a “chi-square”).
In this case, though, it’s pretty obvious: the observed numbers are very different from the predicted numbers.
It’s pretty common for the expected number of animals of each genotype under Hardy-Weinberg equilibrium to be very different from the real numbers we measured. This means that the population is currently undergoing evolution. Hopefully they’ll be able to do it fast enough to avoid extinction by DFTD!
Why use the Hardy-Weinberg equation?
The reason scientists use the Hardy-Weinberg equation is because it provides a null model of evolution. This means that it’s a baseline ruler that scientists can use.
If the actual number of animals of each genotype in the example you saw above matched what would be expected, then we would say that the devils are in Hardy-Weinberg equilibrium, and that the population is not undergoing evolution.
What’s more interesting is when a population is not in Hardy-Weinberg equilibrium. This means that something is causing the population to evolve in some way. Then the fun begins—you need to use your critical thinking skills to find out why the population is evolving. This is what evolutionary and population geneticists as a whole spend their time doing.
What are the rules for Hardy-Weinberg equilibrium?
What if a population is not evolving? In that case, it must be breaking one of the fundamental rules that all populations in Hardy-Weinberg equilibrium must follow. But don’t worry! You can use these rules as your clues. One or more of these rules is being broken, and that’s causing the population to evolve: your job is to figure out which ones. Here are some of them:
Only Two Alleles Per Gene
In this case, we’re looking at very simplified versions of genes with only two possible alleles. But, there can be many alleles! If this is the case, don’t fret; there still are calculations out there to take into account three or more alleles, but the math gets complicated very quickly. It’s best to find one of your math buddies or use a computer program if this is the case.
Sexually-Reproducing Organisms
The Hardy-Weinberg principle relies on the genes being reshuffled every generation. This is what sexually-reproducing organisms do. But, not all organisms reproduce like this; some, like bacteria, simply split in half, essentially creating two clones. The Hardy-Weinberg principle does not apply to these critters because the alleles aren’t being reshuffled in every generation.
No Migration
Hardy-Weinberg applies to one interbreeding population. If the population expands from one generation to the next—say, if some wayward migrants get blown in by a storm—it resets the allele frequency in the population and you need to start from scratch.
Large Population
For these calculations to work, you need to be looking at a large population. If you’re working with a small population, it’s likely that rare alleles might occur in just one or a few individuals, if at all. If some random event happens, like a storm or two lovebirds just never meeting up, these animals (and their rare alleles) could all easily be wiped out. This could very easily have happened with the first few Tasmanian devils who were resistant to DFTD. On the other hand, if the population is large, it’s harder for all of those critters with rare alleles to kick the bucket at once.
In small populations it’s far more likely that alleles will drift away from Hardy-Weinberg equilibrium by chance events alone. Population geneticists call this phenomenon genetic drift.
Random Mating
Hardy-Weinberg relies on random reshuffling of alleles. If those alleles gravitate towards each other—say, if purple-haired individuals tend to stick to their own kind and pink-haired individuals do the same—then the alleles won’t be randomly remixing.
No Selection
Perhaps the biggest reason that populations break from Hardy-Weinberg equilibrium is that some individuals are being selected to pass their alleles on, while others are not. In our Tasmanian devil example, individual devils who are resistant to the disease are far more likely to pass their genes on than susceptible individuals—because those ones will be the first to die.
Selection can either be natural (as in the Tasmanian devil case) or artificial (as in selective breeding by humans). Artificial selection is responsible for a range of crops that we eat and the animals that we have as pets. We started out with wild plants and animals and bred the ones we liked best until we arrive at present-day vegetables and pets.
Why study population and evolutionary genetics?
It’s important to understand how population and evolutionary genetics work so that we can maintain genetic diversity. The more alleles we have in a population for each species, the more likely it is to persist on the landscape.
It’s like having a whole bag of tools at your disposal. If some unexpected disease or other challenge pops up, populations with a high genetic diversity (i.e., high number of different alleles) are more likely to persist because it’s likely that some individual within the population will have the alleles necessary to survive, like the resistant Tasmanian devils. They have the right tool for the job, just like a good Swiss Army knife.
It’s possible that the resistant allele was only present in a handful of devils to begin with; if those had been wiped out by chance, then the entire species would have been doomed because that life-saving treasure would have been lost.
By studying the alleles within populations, scientists can work to ensure that ecosystems function naturally and effectively, no matter what challenges are biting them in the face.
Related Topics

Evolution can be a tricky thing. In some cases, it’s easy to see it happening. During the Industrial Revolution in Great Britain, for example, white moths disappeared from the population as they were more easily spotted and eaten by birds in the increasingly sooty and blackened environment.
In most cases, though, it’s not so easy to see evolution happening. It can happen slowly over many generations, or in long-lived species. It could also happen within an organism, affecting its metabolic or physiological processes, for example.
How are we supposed to know if something is evolving, then? To do that, we need to look at the genetics of an entire population and something called the Hardy-Weinberg Principle.
You! Out of the gene pool!
A gene pool isn’t really a swimming pool full of genes (as fun as that sounds). Rather, a gene pool is simply all of the genes (and their associated alleles) within an interbreeding population.
An interbreeding population is defined as one which freely interbreeds with each other, such as a group of geese who migrate to the same summer breeding grounds or a group of all the people who can meet each other. As you can imagine, the human breeding pool has become a lot larger due to globalization and the ability to meet almost anyone over the internet.
So, rather than looking at a herd of deer and wondering which ones have a particular trait, you’d instead look at a list of all the alleles for that trait in the herd’s genomes.
The reason we look at gene pools is because we can compare them over time. Let’s say that we were studying a population of arctic wolves. Over time, the percentage of black wolves increases. In this case, the black fur allele is increasing in frequency among the wolves. The population is evolving.
We can’t always easily see what alleles an individual has, though, like we can with black wolves. Maybe all the organisms look normal on the outside, but they have something unique hidden away within each of them. So, rather than rely on something observable, like fur color, evolutionary geneticists rely on numbers.
The Hardy-Weinberg Principle: A Magic Number
After scientists first discovered how genetics work in the late 18th century, they realized they had a problem. They knew how alleles were passed on between individuals from generation to generation, but how could they describe if populations of organisms were evolving?
Godfrey Hardy and Wilhelm Weinberg both came up with the solution in 1908—individually, oddly enough. Today, we call it the Hardy-Weinberg principle, and it measures the genetic makeup of a population at a single point in time.
If you compare the genetic makeup over time or to certain expected numbers, then boom: you can literally see if your population is evolving. In this case, we use numbers to describe what we cannot necessarily see with our eyes.
It works like this:
If there are two alleles in a population—p and q—each allele will have an allele frequency. For example, 30% of the population could have the p allele and 70% could have the q allele. Or, maybe 50% of the population has the p allele and the other 50% has the q allele.
These two alleles can make up three possible genotypes: pp, pq, and qq (the same as the YY, Yy, and yy of Mendel’s pea plants).
Here’s the cool thing: if you know the allele frequency of the two genes, you can also predict the genotype frequency in the population with some neat math:
p2 + 2pq + q2 = 1
This is because each pp individual will have two p alleles (p2), each pq individual has a p and a q allele (2pq), and each qq individual has two q alleles (q2).
This formula calculates the genotype frequencies for a population that is not evolving. If a population actually has these genotype frequencies, we say that the population is in Hardy-Weinburg equilibrium.
It might help to look at an example.
How do you calculate Hardy-Weinberg equilibrium?
Do you remember the Tasmanian devil from the Looney Tunes? Tasmanian devils are real animals. They look like small dogs, and they’re mean. So mean, in fact, that they tend to get bitten a lot around their faces when mating.
Unfortunately, this aggressive behavior has opened the way for a deadly contagious cancer called Devil Facial Tumor Disease (DFTD) to make its way into the population. These animals are already endangered, and the tumor sure isn’t helping much.
Luckily, some of the animals in the population are resistant to the cancer. These animals are more likely to pass on their resistance genes, and so the population as a whole is evolving to become more resistant to DFTD.
But how did scientists find that out? Let’s put on our safari hats and find out.
Let’s pretend we went on a Tasmanian expedition. Once we got there, we collected DNA samples from all of the Tasmanian devils we could find. Then, we brought the samples back to the lab and analyzed them for a gene that makes the devils resistant.
In this example, having a D allele makes devils more susceptible to the disease, while the d allele makes them more resistant. Let’s pretend this is how many animals of each genotype we measure:
Now, we need to figure out the allele frequencies for the two alleles so that we can plug them into the Hardy-Weinberg equation to see if the population is evolving.
To start, we need to know how many animals are in our “population.” For this, we simply add up all of the animals we sampled of each genotype:
Total number of animals sampled: 67 + 412 + 209 = 688
Each animal has two alleles, so we simply multiply the number of animals by two to find out how many total alleles we’re working with:
Total number of alleles: 688 • 2 = 1,376
Now we need to figure out how many of each of the two alleles are in the population. Each DD devil has two D alleles, while each Dd devil has one D allele, so we simply add these together. Then, we do the same thing for the d allele.
Number of D alleles: 67 + 67 + 412 = 546
Number of d alleles: 412 + 209 + 209 = 830
Finally, we are able to calculate the allele frequencies because we know how many of each allele we’re working with, and how many total alleles there are. So, to find the D allele frequency, we divide the number of D alleles by the total number of alleles. Then, we do the same thing for the d allele.
D allele frequency: 546 / 1,376 = 0.40
d allele frequency: 830 / 1,376 = 0.60
Now we’re able to actually use the Hardy-Weinberg equation. We know the allele frequencies for the two alleles, so we can calculate how many animals in the population there should be for each genotype if it is in Hardy-Weinberg equilibrium (i.e., is not evolving).
To do this, we multiply the total number of animals in our sample by the expected genotype frequencies as predicted by the Hardy-Weinberg equation:
Expected number of DD devils: 688 • 0.402 = 110
Expected number of Dd devils: 688 • 2 • 0.40 • 0.60 = 330
Expected number of dd devils: 688 • 0.602 = 248
Now, let’s compare the observed number of devils we actually measured of each genotype with the Hardy-Weinberg expected values:
As you can see, the expected values are way off from the actual observed values. Scientists can actually see if these results are real or just random numbers from chance by using a statistical test called a χ2 (a “chi-square”).
In this case, though, it’s pretty obvious: the observed numbers are very different from the predicted numbers.
It’s pretty common for the expected number of animals of each genotype under Hardy-Weinberg equilibrium to be very different from the real numbers we measured. This means that the population is currently undergoing evolution. Hopefully they’ll be able to do it fast enough to avoid extinction by DFTD!
Why use the Hardy-Weinberg equation?
The reason scientists use the Hardy-Weinberg equation is because it provides a null model of evolution. This means that it’s a baseline ruler that scientists can use.
If the actual number of animals of each genotype in the example you saw above matched what would be expected, then we would say that the devils are in Hardy-Weinberg equilibrium, and that the population is not undergoing evolution.
What’s more interesting is when a population is not in Hardy-Weinberg equilibrium. This means that something is causing the population to evolve in some way. Then the fun begins—you need to use your critical thinking skills to find out why the population is evolving. This is what evolutionary and population geneticists as a whole spend their time doing.
What are the rules for Hardy-Weinberg equilibrium?
What if a population is not evolving? In that case, it must be breaking one of the fundamental rules that all populations in Hardy-Weinberg equilibrium must follow. But don’t worry! You can use these rules as your clues. One or more of these rules is being broken, and that’s causing the population to evolve: your job is to figure out which ones. Here are some of them:
Only Two Alleles Per Gene
In this case, we’re looking at very simplified versions of genes with only two possible alleles. But, there can be many alleles! If this is the case, don’t fret; there still are calculations out there to take into account three or more alleles, but the math gets complicated very quickly. It’s best to find one of your math buddies or use a computer program if this is the case.
Sexually-Reproducing Organisms
The Hardy-Weinberg principle relies on the genes being reshuffled every generation. This is what sexually-reproducing organisms do. But, not all organisms reproduce like this; some, like bacteria, simply split in half, essentially creating two clones. The Hardy-Weinberg principle does not apply to these critters because the alleles aren’t being reshuffled in every generation.
No Migration
Hardy-Weinberg applies to one interbreeding population. If the population expands from one generation to the next—say, if some wayward migrants get blown in by a storm—it resets the allele frequency in the population and you need to start from scratch.
Large Population
For these calculations to work, you need to be looking at a large population. If you’re working with a small population, it’s likely that rare alleles might occur in just one or a few individuals, if at all. If some random event happens, like a storm or two lovebirds just never meeting up, these animals (and their rare alleles) could all easily be wiped out. This could very easily have happened with the first few Tasmanian devils who were resistant to DFTD. On the other hand, if the population is large, it’s harder for all of those critters with rare alleles to kick the bucket at once.
In small populations it’s far more likely that alleles will drift away from Hardy-Weinberg equilibrium by chance events alone. Population geneticists call this phenomenon genetic drift.
Random Mating
Hardy-Weinberg relies on random reshuffling of alleles. If those alleles gravitate towards each other—say, if purple-haired individuals tend to stick to their own kind and pink-haired individuals do the same—then the alleles won’t be randomly remixing.
No Selection
Perhaps the biggest reason that populations break from Hardy-Weinberg equilibrium is that some individuals are being selected to pass their alleles on, while others are not. In our Tasmanian devil example, individual devils who are resistant to the disease are far more likely to pass their genes on than susceptible individuals—because those ones will be the first to die.
Selection can either be natural (as in the Tasmanian devil case) or artificial (as in selective breeding by humans). Artificial selection is responsible for a range of crops that we eat and the animals that we have as pets. We started out with wild plants and animals and bred the ones we liked best until we arrive at present-day vegetables and pets.
Why study population and evolutionary genetics?
It’s important to understand how population and evolutionary genetics work so that we can maintain genetic diversity. The more alleles we have in a population for each species, the more likely it is to persist on the landscape.
It’s like having a whole bag of tools at your disposal. If some unexpected disease or other challenge pops up, populations with a high genetic diversity (i.e., high number of different alleles) are more likely to persist because it’s likely that some individual within the population will have the alleles necessary to survive, like the resistant Tasmanian devils. They have the right tool for the job, just like a good Swiss Army knife.
It’s possible that the resistant allele was only present in a handful of devils to begin with; if those had been wiped out by chance, then the entire species would have been doomed because that life-saving treasure would have been lost.
By studying the alleles within populations, scientists can work to ensure that ecosystems function naturally and effectively, no matter what challenges are biting them in the face.